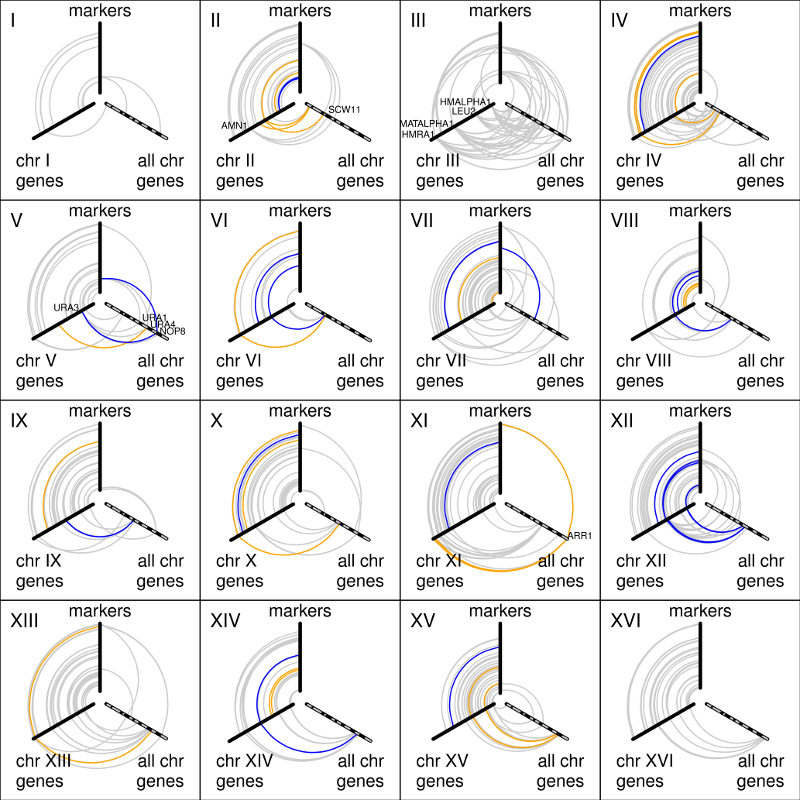
Figure 6. eQTL network of a yeast cross
Hive plots of an eQTL network estimated from a yeast cross, involving only
connected components with at least one eQTL association. For each
chromosome, the hive plot shows three axes, where markers and genes are ordered
from the center according to their genomic location. Vertical and left axes
represent the chromosome in the corresponding panel, while the right axis
represents the entire yeast genome alternating black and gray along consecutive
chromosomes. Edges between genes axes correspond to gene-gene associations.
Edges where at least one of their endpoints corresponds to a transcription factor
or RNA-binding coding gene, are highlighted in orange and blue, respectively.