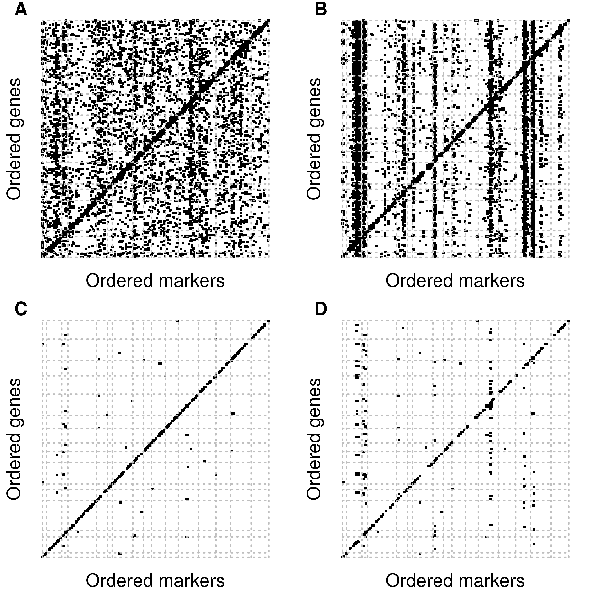
Figure 3. Enrichment of cis-acting eQTL associations.
Dot plots of eQTL associations in yeast, where the $x$-axis and $y$-axis
represent positions along the genome of markers and genes, respectively.
Diagonal bands arise from cis-eQTLs while vertical ones from
trans-eQTLs. Each row of two plots shows the top-k eQTLs with
largest strength in terms of non-rejection rates (A, C) and p-values
for the null hypothesis of marginal independence (B, D), where k is
the number of eQTLs meeting a liberal (A) and conservative (C) cutoff
on the non-rejection rate. Hence, plots in each row contain the same
number of eQTLs.