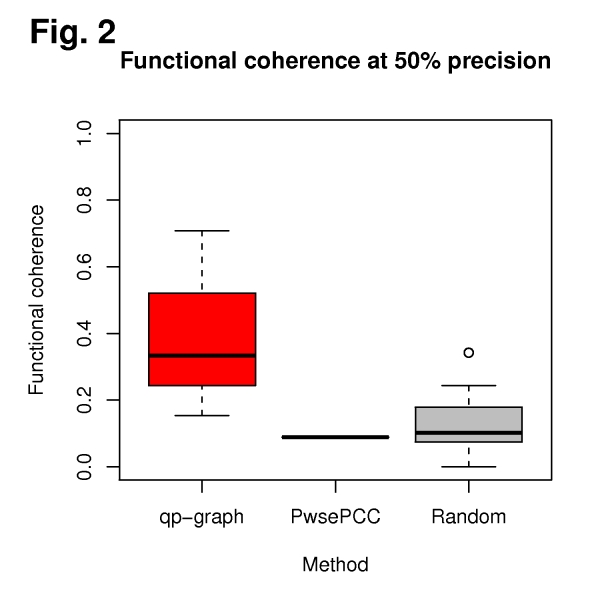
Figure 2: Distributions of functional coherence values for transcriptional networks obtained at 50% nominal precision with the following three reverse-engineering methods: assignment a random correlation (Random); estimation of Pearson correlation coefficients (Pairwise PCC); estimation of average non-rejection rates (qp-graph).