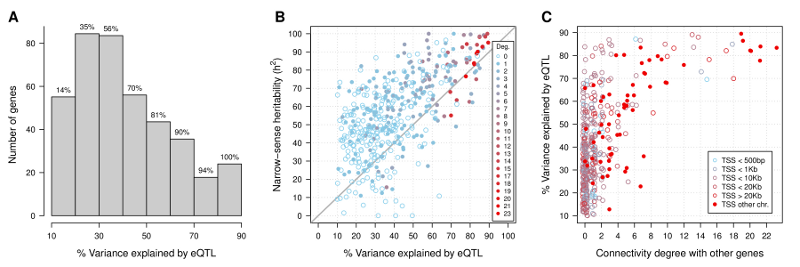
Figure 5. Variance explained in the eQTL network
(A) Distribution of the percentage of gene expression variance explained by
eQTLs. The cumulative percentage of genes is reported on top of each bar.
(B) Scatter plot of the narrow-sense heritability h2 as
function of the percentage of variance explained by eQTLs. The diagonal line
is drawn at values where this percentage equals h2, and it
is only shown as a visual guide. Open circles correspond to genes with
exclusively eQTL associations while solid ones indicate also the presence of
at least one association with other gene. The legend contains the color key
for the degree of association in the network. (C) Percentage of variance
explained by eQTLs as function of the degree of association with other genes
in the network. The legend specifies the color key for the average distance
from the transcription start site (TSS) of the gene to its eQTLs.