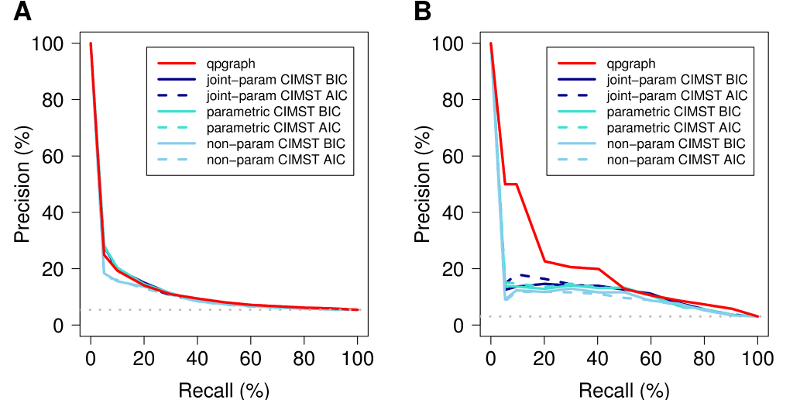
Figure 4. Comparison of qpgraph with qtlhot/CMST.
Precision-recall curves calculated from predicted regulatory relationships
inferred from a yeast cross data set using the approach introduced in this paper
(qpgraph) and 6 different configurations of the qtlhot/CMST method.
In (A) predictions are compared against a bronze standard formed by relationships
formed by knocked-out genes and their putative targets derived from differential
expression (Hughes et al., 2000; Zhu et al., 2008). In (B) this
bronze standard is further restricted to relationships also present in the
Yeastract database (Teixeira et al., 2014) of curated transcriptional
regulatory associations. The horizontal gray dotted line indicates the baseline
precision attained by a random predictor.