Figure 2. Explicit and implicit adjustment of confounding with higher-order
conditional independence tests
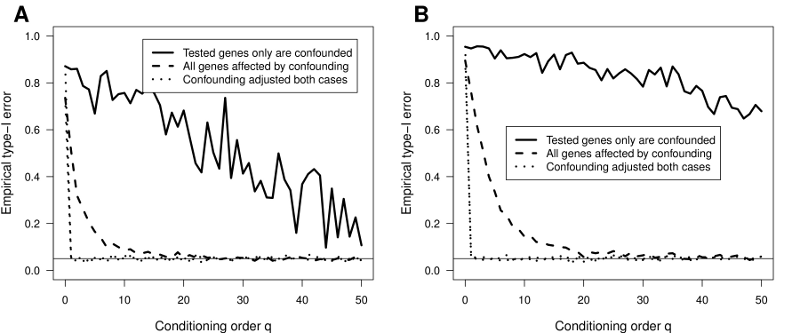
Empirical type-I error rate for conditional
independence tests from simulated data at a nominal level α0.05
(dotted horizontal line) as function of the conditioning order $q$. Panel (A)
shows results on testing for an absent eQTL association while panel (B) shows them
for an absent gene-gene association. Solid lines correspond to the model under
which confounding affects only the tested genes while dashed lines correspond
to a confounding effect on all genes. Dotted lines from both confounding models
overlap because they correspond to the inclusion of the confounding effect in
the conditioning subsets, thereby explicitly adjusting for it.